Des alertes de disponibilité en temps réel qui vous aident à agir vite
Publié le 17 juillet 2026
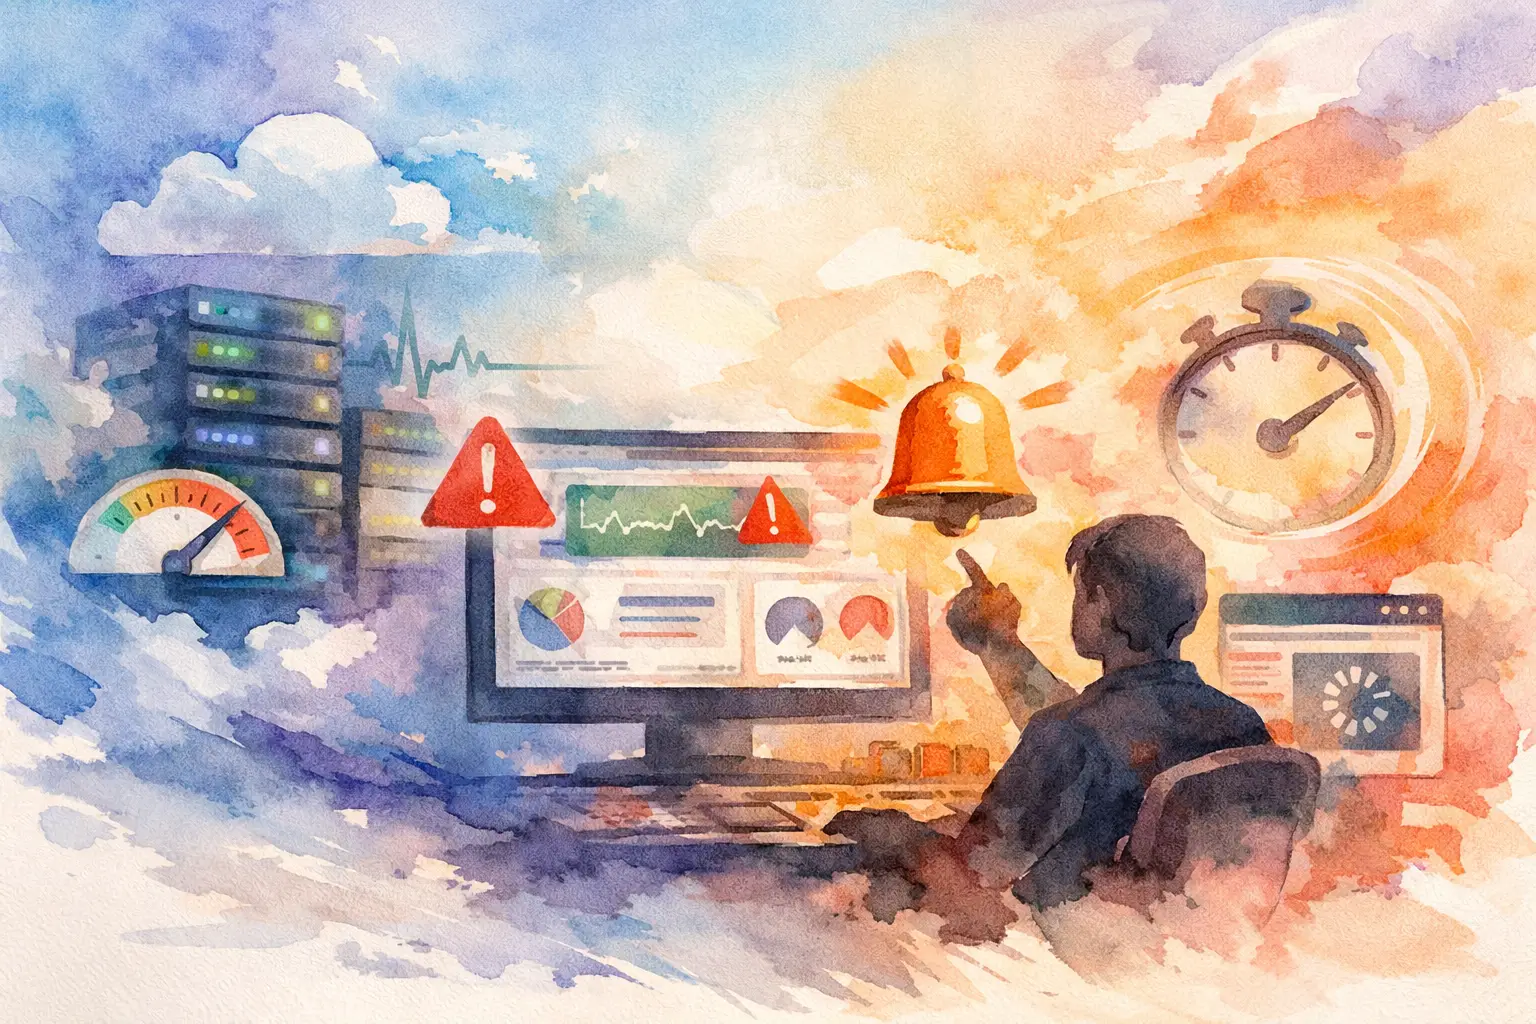
Un site web peut tomber en panne à 2 h 13 du matin, pendant le lancement d’une campagne, ou cinq minutes avant qu’un client n’examine une nouvelle page. Le problème est rarement qu’il n’y ait personne pour le réparer. Le problème, c’est de le découvrir trop tard. Les alertes de disponibilité en temps réel comblent cet écart en vous indiquant lorsqu’un site web, un service ou un serveur cesse de répondre, afin que la bonne personne puisse commencer à vérifier avant que la panne ne se transforme en file d’attente du support.
Pour un site personnel, quelques minutes d’indisponibilité peuvent être gênantes. Pour une boutique en ligne, une agence, un fournisseur d’hébergement ou une entreprise qui dépend des prospects, ces minutes peuvent signifier des commandes perdues, une confiance endommagée et une très longue matinée. La surveillance ne consiste pas à fixer des tableaux de bord toute la journée. Il s’agit d’avoir un signal fiable lorsque votre attention est nécessaire.
Ce que surveillent réellement les alertes de disponibilité en temps réel
Une alerte de disponibilité commence par une vérification régulière. Un service de surveillance interroge votre site web ou un service spécifique et attend une réponse attendue. Si la réponse n’arrive pas, arrive trop lentement ou renvoie une erreur, le système peut envoyer une notification par e-mail, application de messagerie, SMS ou un autre canal.
L’expression « en temps réel » mérite un peu d’honnêteté. Aucun système de surveillance ne voit une panne à la milliseconde exacte où elle commence. Les vérifications s’exécutent à intervalle régulier, souvent toutes les une à cinq minutes, et la plupart des configurations sensées confirment une défaillance avant d’alerter. Ce court délai est intentionnel. Il permet d’éviter qu’un problème réseau temporaire ne réveille votre équipe sans raison.
Ce que vous surveillez dépend de ce sur quoi repose votre entreprise. Une vérification de site web confirme que les visiteurs peuvent atteindre une page via HTTP ou HTTPS. Une vérification de port peut vous indiquer si un service tel que SSH, SMTP, MySQL ou un endpoint d’application personnalisé accepte des connexions. Une vérification plus approfondie peut confirmer qu’une page contient le texte attendu, qu’un chemin de connexion fonctionne ou qu’une API renvoie une réponse valide.
Un serveur peut être en ligne alors que le site web est en panne. L’inverse peut aussi se produire : une page web peut se charger depuis le cache alors que la base de données, le service de messagerie ou les tâches planifiées sont en panne. C’est pourquoi un ping générique est utile, mais pas toujours suffisant.
Pourquoi les alertes comptent plus qu’un tableau de bord au vert
Un tableau de bord est utile lorsque vous soupçonnez déjà un problème. Une alerte est ce qui rend la surveillance utile lorsque vous êtes occupé à faire tout le reste.
Sans alertes, les temps d’indisponibilité sont souvent découverts par un client, un collègue ou une notification de paiement qui n’arrive jamais. Cela crée un désavantage évitable : les personnes affectées le savent avant les personnes responsables. Les alertes de disponibilité en temps réel vous donnent la possibilité d’enquêter d’abord, de communiquer clairement et de rétablir le service avec moins de pression.
Elles créent aussi un historique. Sur plusieurs semaines et plusieurs mois, les événements de disponibilité peuvent révéler des schémas qu’il est facile de manquer dans le travail quotidien. Peut-être qu’un site ralentit pendant les sauvegardes. Peut-être qu’un fournisseur connaît de brèves défaillances dans une région. Peut-être qu’une mise à jour de plugin WordPress déclenche des erreurs après chaque déploiement. Un historique des incidents horodaté transforme « le site semble peu fiable » en quelque chose que vous pouvez examiner.
Pour les agences et les fournisseurs d’hébergement, cette visibilité fait partie du service. Les clients n’ont pas besoin d’un exposé technique après une panne. Ils ont besoin de savoir que quelqu’un a vu le problème, a agi et peut expliquer ce qui s’est passé en langage clair.
Configurez des alertes auxquelles les gens feront confiance
Le moyen le plus rapide de rendre la surveillance inutile est de créer des alertes auxquelles personne ne croit. Si chaque petit délai d’attente produit cinq messages, les gens apprennent à les ignorer. Une configuration d’alertes utile est suffisamment précise pour détecter les vraies défaillances et suffisamment calme pour laisser les gens travailler.
Commencez par le parcours client
Surveillez d’abord le parcours qui compte pour les visiteurs. Pour la plupart des sites web, cela signifie une vérification HTTPS sur le domaine public, et pas seulement une adresse IP du serveur. Une IP peut répondre alors que le DNS, la configuration du serveur web, le certificat SSL, l’hôte virtuel ou l’application elle-même est indisponible.
Choisissez une page qui représente un service significatif. La page d’accueil est généralement un bon point de départ. Pour l’e-commerce, ajoutez si possible une page produit ou un endpoint lié au paiement. Pour les applications web, un endpoint d’état léger peut être préférable à une page qui exécute chaque minute une requête lourde sur la base de données.
Évitez de surveiller une URL qui redirige à travers plusieurs systèmes sans lien, sauf si ce flux est exactement ce que vous devez tester. Un endpoint simple et stable rend les défaillances plus faciles à interpréter.
Confirmez les défaillances avant d’avertir tout le monde
Une seule requête échouée ne signifie pas toujours une panne. Le système de surveillance peut avoir un problème temporaire de routage, ou le serveur peut être en train de redémarrer. Configurez une nouvelle tentative ou exigez une confirmation depuis plus d’un emplacement de surveillance lorsque c’est possible.
Il y a un compromis à faire. Davantage de confirmation réduit les fausses alertes, mais ajoute quelques minutes avant l’alerte. Une boutique publique ou un portail client peut justifier une notification plus rapide. Un site vitrine à faible trafic sera peut-être mieux servi par un seuil légèrement plus prudent. Définissez la règle en fonction du coût d’une indisponibilité manquée par rapport au coût d’une interruption inutile de quelqu’un.
Envoyez les alertes sur le bon canal
L’e-mail fonctionne bien pour les incidents non urgents et les relevés d’état. Les notifications de messagerie sont souvent meilleures pour une petite équipe qui doit se coordonner rapidement. Une escalade par SMS ou par téléphone peut avoir du sens pour les services critiques, mais utilisez-les avec précaution. À 3 h du matin. devrait signifier que quelque chose demande vraiment de l’attention.
Clarifiez la responsabilité. Si une alerte arrive dans une boîte de réception partagée que personne ne consulte en dehors des heures de travail, ce n’est pas un plan d’alerte. Pour les environnements clients, décidez à l’avance si votre équipe répond en premier, si le client reçoit la notification initiale et qui gère la communication avec le fournisseur d’infrastructure.
Associez les vérifications externes de disponibilité à la surveillance du serveur
Les vérifications externes répondent à une question simple : le public peut-il atteindre ce service ? La surveillance du serveur répond à une autre : que se passe-t-il à l’intérieur de la machine ?
La charge CPU, la mémoire disponible, l’utilisation du disque, les E/S disque, le trafic réseau et l’état des services vous donnent du contexte lorsqu’une alerte de disponibilité arrive. Un disque plein peut empêcher les bases de données d’écrire. La pression sur la mémoire peut provoquer le redémarrage des processus. Une charge CPU élevée peut indiquer du trafic, un processus bloqué ou une tâche applicative devenue bien plus coûteuse que prévu.
Aucune de ces deux vues ne remplace l’autre. La surveillance interne peut sembler normale alors qu’un problème de DNS ou de pare-feu bloque les visiteurs. La surveillance externe peut signaler l’échec d’un site sans montrer si la cause est Nginx, PHP-FPM, une connexion à la base de données ou le serveur lui-même. Ensemble, elles raccourcissent le chemin entre « quelque chose est en panne » et « voici où chercher ».
FASTPANEL aide à garder cette vue opérationnelle proche du travail de gestion des sites, des domaines, des bases de données et des ressources serveur. C’est important lorsque la personne qui reçoit une alerte n’est pas un spécialiste de l’infrastructure à plein temps. Des informations claires font gagner du temps, et le temps est généralement la première chose qu’une panne commence à vous prendre.
Élaborez une routine de réponse avant d’en avoir besoin
Une alerte n’est qu’un début. Une courte routine de réponse empêche que les premières minutes se transforment en clics au hasard.
Lorsqu’une alerte de site web arrive, confirmez d’abord l’incident depuis un autre navigateur ou un autre réseau si possible. Vérifiez si le problème affecte un seul domaine ou tous les sites du serveur. Examinez les changements récents : déploiements, mises à jour de plugins, renouvellements de certificats, règles de pare-feu, sauvegardes, modifications DNS ou maintenance du fournisseur. Vérifiez ensuite les ressources du serveur et les journaux du service concerné.
Si le problème affecte plusieurs sites web, commencez par les composants partagés tels que le serveur, le serveur web, le service de base de données, l’espace disque ou la connexion réseau. Si un seul site est affecté, inspectez les journaux d’application de ce compte, les paramètres PHP, les permissions et les changements récents avant de redémarrer des services généraux qui pourraient affecter tous les autres.
Les redémarrages sont parfois nécessaires, mais ils ne constituent pas un diagnostic. Ils peuvent temporairement masquer les preuves dont vous avez besoin pour éviter le prochain incident. Si vous redémarrez un service pour rétablir la disponibilité, notez l’heure, les symptômes et ce qui a changé ensuite. Cette petite habitude facilite grandement le traçage des problèmes récurrents.
Surveillez aussi les alertes de rétablissement
Une notification de défaillance vous indique quand agir. Une notification de rétablissement vous indique si l’action a fonctionné. Les deux sont importantes.
Les alertes de rétablissement évitent une erreur fréquente : supposer qu’un site est revenu simplement parce qu’une page se charge une fois. Elles aident aussi à mesurer la durée réelle d’un incident et montrent si le service alterne entre fonctionnement et panne. Des rétablissements et défaillances répétés indiquent généralement un problème sous-jacent de capacité, de configuration, de réseau ou d’application qui demande plus qu’une solution rapide.
Utilisez les messages de rétablissement pour boucler la communication avec les clients ou les coéquipiers. Une mise à jour claire telle que « Le service a été rétabli à 10 h 42 ; nous examinons la cause » est bien plus utile que le silence après la notification initiale de panne.
Gardez une surveillance utile à mesure que votre configuration s’agrandit
À mesure que vous ajoutez des domaines, des comptes clients, des sites de staging et des services, ne surveillez pas tout avec la même règle. Un site de staging peut n’avoir besoin que d’une notification par e-mail pendant les heures ouvrables. Un site de production qui traite des paiements peut nécessiter des vérifications fréquentes, une escalade et un responsable de réponse. La distribution du courrier, les sauvegardes, l’expiration SSL et les seuils de ressources serveur peuvent mériter une surveillance distincte, car ils peuvent échouer sans mettre la page d’accueil hors ligne.
Revoyez les alertes après de vrais incidents. Demandez-vous si l’alerte est arrivée assez tôt, si elle a atteint la bonne personne et si elle contenait assez d’informations pour commencer le dépannage. Ajuster un intervalle de vérification ou une règle de notification est une petite tâche. Découvrir que vos alertes pointaient vers le mauvais endroit pendant une panne n’en est pas une.
L’objectif n’est pas de créer plus de notifications. Il s’agit de créer une routine opérationnelle plus calme et plus claire, dans laquelle un vrai problème est remarqué rapidement, traité sereinement et transformé en leçon utile pour la prochaine fois qu’un serveur décidera de se comporter de manière créative.